“IPO.” The elusive dream of many a startup founder. Today, it’s an even more elusive dream than ever, as more and more startups are lining up at the window to go public as soon as it opens (which will hopefully be soon). But what does it take to IPO? How does an early-stage founder at $10M or $25M ARR know if they’re on the path to that ambitious goal of an IPO? The first question is a hard one to answer, and not one we’ll be getting into here. There are plenty of different viewpoints on when exactly to IPO, many from people who know public markets much better than I, that you can go read.
We’ll be focusing on the pre-IPO stage – what it takes for an entrepreneur to stay on track for an IPO as they scale their startup all the way from zero to public. That’s a question we can answer with data (and we have a lot of data), so buckle in as we cover a journey that takes founders 10+ years in a couple pages.
(Re-)Introducing the Mendoza Line for SaaS
We first coined the phrase “Mendoza line for SaaS” six years ago, and it’s about time for a refresh. The Mendoza line originally referred to the batting average below which a player is not worth hiring for the MLB. Partner Rory O’Driscoll repurposed the term for venture as the ARR growth rate at every stage of a SaaS company below which the company is not on a venture-backable trajectory. At its core, the Mendoza line answers the question, “At a given ARR level, what should my growth rate be if I want to eventually reach IPO scale?”
In the late 2010s, the popular wisdom was that “IPO scale” meant a $100M ARR business growing at 30% year-on-year. It’s safe to say things have changed. Public markets were a whole different world in 2018. Today, with companies staying private longer and IPO volumes at historic lows, the bar for a successful IPO is much higher. For the sake of this analysis, we’ll use a more ambitious target of $250M ARR growing at 25%, with a clear path to profitability. Again, don’t take this as gospel truth for when to IPO, but for the math to work we have to draw a line in the sand to aim for, and we believe this is a fair target in today’s world.
Now that we’ve set our target, the question turns back to, “How can I tell if I’m on track to reach it?” For this, we lean on two numbers: the Mendoza Line and growth persistence.
Growth persistence is a concept Scale Partner Andy Vitus introduced over ten years ago. It describes the constant pull of gravity on startup growth rates: as you grow in scale, your % year-on-year ARR growth decreases. This makes sense – it’s a lot easier for a $1M ARR company to grow 100% in a year than it is for a $100M ARR company. In our original analysis, the growth persistence rate expected from SaaS companies was 85%, meaning we expect each year’s growth rate to be 85% of the prior year’s growth rate. We refreshed the original growth persistence analysis to see if our original number has changed since 2012. There was some noise in the last couple of years as we emerged from the pandemic and bull / bear markets that followed, but reassuringly there was no significant change in the long-term median and average.
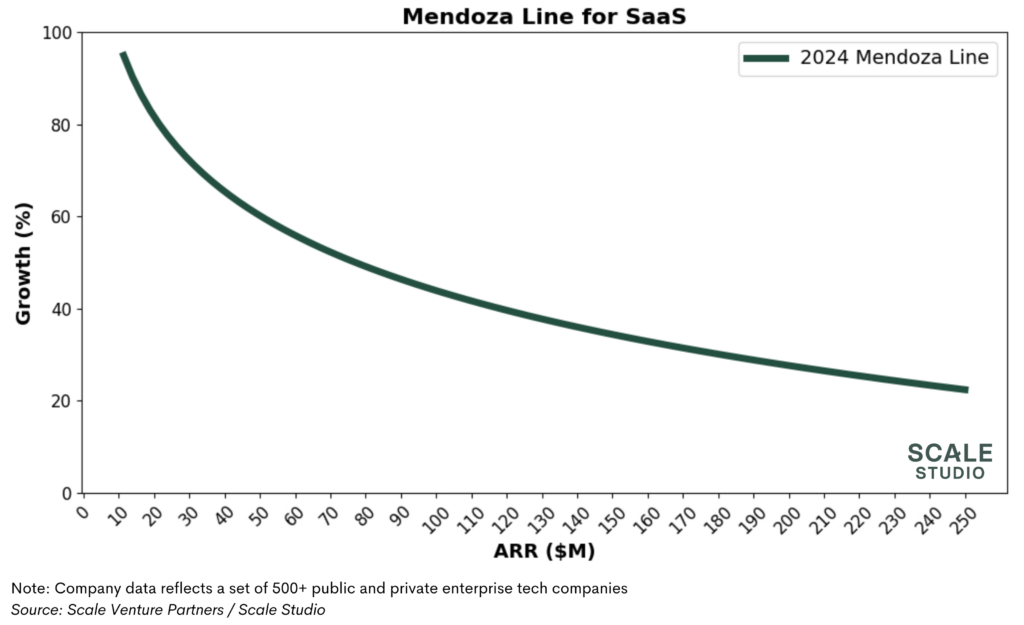
Using this concept of growth persistence, we can take today’s growth rate and estimate what it could be one year into the future or, as we’ll do here, what it could have been a year ago. Starting with the end goal of $250M ARR growing at 25%, we can work backwards and get the ARR-growth curve that shows at every level of ARR what your growth rate should be so that you eventually end up at $250M ARR growing 25%. This obviously oversimplifies all the operational hurdles and challenges that you’ll encounter when building an IPO-scale company. But from a purely “looking at the numbers” approach, it gives you a good sense of a rough growth trajectory that can help you set growth targets and understand potential exit scenarios.
The Mendoza Line for SaaS helps us understand where a startup sits in terms of potential to reach IPO scale. If you’re above the line, you’re growing at a rate fast enough that it, given regular growth persistence, will put you at an IPO scale in a couple of years. If you’re under the line, you need to find a way to fight gravity and reaccelerate growth, or start pushing towards profitability and considering other exit options.
How does this compare to 2018?
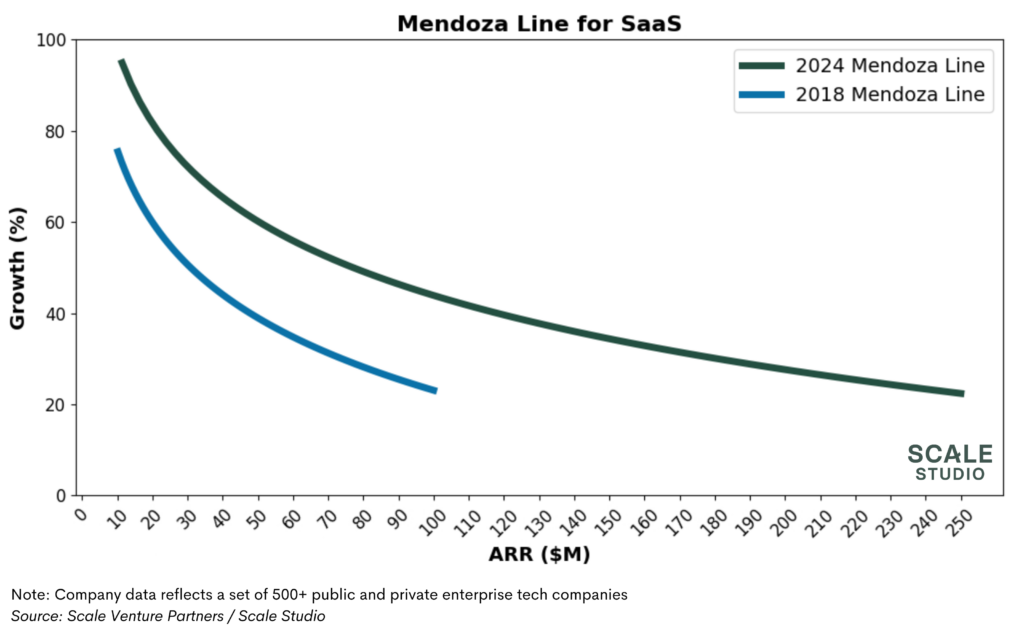
If we compare this updated view to where we were six years ago, it’s obvious the bar for a startup to IPO is much higher today. In 2018, if you started at $10M ARR growing at 77%, you could reach IPO scale in six years. Today, starting at $10M ARR, you need to be growing at least 100%, and even at that higher starting growth rate it’ll take you eight years to reach IPO scale. This is doubly hard, because you both need to hit a higher growth rate AND maintain that higher growth rate for two more years. That’s what it takes for a startup to get to IPO today, and with only ~1% of startups actually IPOing, it’s an elusive target. But if you remain above the Mendoza Line, you could be one of the rare few who make it.
How do you stay above the line? And what if you fall below it?
To maximize your odds of a successful exit, staying above the Mendoza Line in terms of growth is key. Even in today’s venture markets there is still a premium put on growth, and keeping an IPO on the table as a potential outcome is key to attracting venture funding. By staying above the Mendoza Line, you remain “default investable” and should be able to raise more capital to keep you on your trajectory. The growth rates for your scale above are what you should be targeting in your annual plan each year and driving your team towards. But with software growth rates bouncing around historical lows, it can be hard to maintain a high enough growth rate for eight years, and you could fall below the line.
Once your growth slows, venture funding starts to dry up, as can be seen in the decrease in VC activity last year. As a result, it’s key to make your current cash last and aim for cash-flow breakeven. Last year we saw one of the most pronounced shifts towards efficiency we’ve ever seen in tech markets. Startups and public companies alike cut burn across the board, with some top-decile startups even reaching operating profitability. Now, will all these companies IPO? Some of them, maybe. Most of them, realistically not. But they’ll weather the storm and make it out alive. What that actually means is likely a mix of PE buyouts, mergers with similar-sized startups to achieve IPO scale, or getting acquired by a larger company. With recent signals that M&A markets are picking up this year, hopefully we’ll see better exits even for companies not on a direct trajectory to IPO.
While not ideal, falling off an IPO trajectory isn’t the end of the world. You can still recover, or look for a different exit strategy. One in three companies we looked at were able to reaccelerate growth after a year of decline, so if you dip below the line one year there’s still a chance you can recover. But as time goes on it gets harder — only one in ten companies were able to reaccelerate growth two years in a row. The most important thing to do if you don’t see growth coming back is to cut the burn and grab control of your own destiny.
How to calculate your own Mendoza line
As we said at the beginning, we don’t know the exact ARR and growth point at which a software company can IPO today. Instead, we just drew a line in the sand at $250M growing at 25% — a relatively round number to target. With some folks recently saying that the bar to IPO could be as high as $1B ARR, we decided it would be best not to delve too deep into that discussion, and focus on where we can provide value: with data for early-stage startups.
To that end, we built the tool below to help you chart your course towards IPO, or whatever ARR + growth target you want to hit, assuming regular growth persistence. You can either enter your current ARR and growth rate and see what your future could hold, or enter in your target ending ARR and target growth rate and see what the Mendoza Line looks like to get to that end goal. For example, if we target $1B (or $1,000M) in ARR growing at 20% ten years from now, we would need to be at $25M ARR growing 102% today, and we’d need to maintain that momentum for another 10 years while driving to profitability.
| Year | 0 | 1 | 2 | 3 | 4 | 5 | 6 | 7 | 8 | 9 | 10 |
|---|---|---|---|---|---|---|---|---|---|---|---|
| ARR | $10.0M | $18.5M | $31.9M | $51.4M | $78.3M | $113.0M | $155.6M | $205.5M | $261.6M | $322.1M | $385.6M |
| Growth Rate | 100% | 85% | 72% | 61% | 52% | 44% | 38% | 32% | 27% | 23% | 20% |
Hopefully our analysis above and our build-your-own Mendoza Line tool will be helpful as you think through what it’ll take to build your startup into the next great public company. It can be a long and difficult journey, but the payoff is worth it.