In enterprise software, 2020 marked a year of extremes. 1H20 showed the dramatic impact of a global pandemic while for many 2H20 represented a rapid recovery. Performance data from Scale’s portfolio of 40+ enterprise software companies shows companies are entering 2021 with a renewed sense of optimism as seen in forecasts for widespread re-acceleration of growth.
This update is a continuation of our previous Flash Report covering Scale Studio data on Q4 and FY20. We’ve included companies with January fiscal year ends, increasing the size of the dataset to give a more precise snapshot of enterprise software performance in 2020 and expectations for 2021.
One new and important data point here covers Magic Number efficiency, which stabilized in the second half of the year. But first here’s an overview of the latest data:

Growth Benchmarks
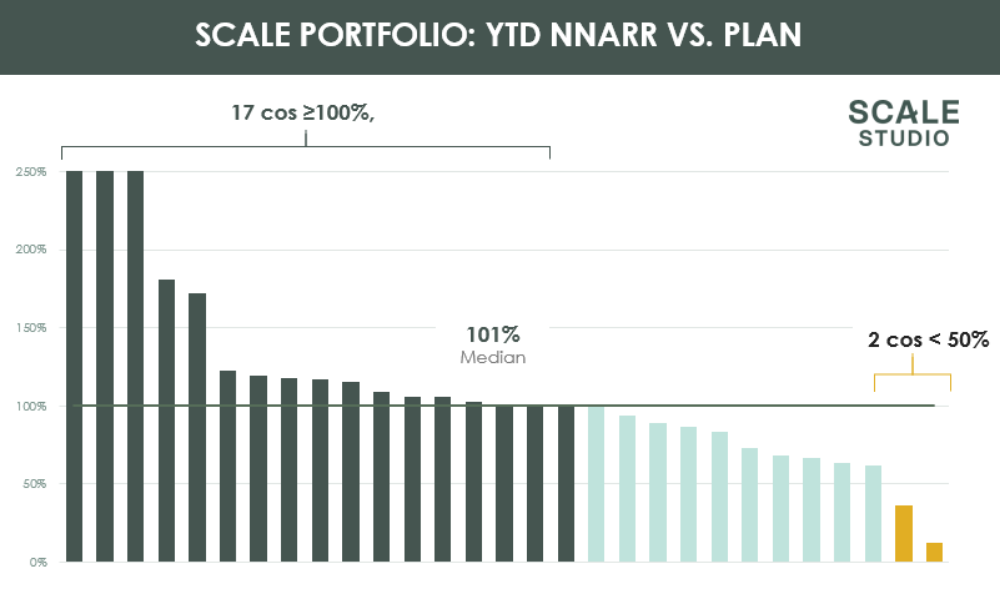
One way to gauge the health of enterprise SaaS is attainment, defined as the ratio between a company’s actual Net New ARR Growth versus forecast NNARR growth. Attainment of 100% means a company met its target exactly.
For the full year 2020, median attainment was 101%. So despite all of the work required to adjust operations for Covid realities, strength in Q3 and Q4 provided enough of a boost for the median performer to ultimately achieve its forecasts. Hat tip to all the teams for the creativity and sweat equity required to bring that about.
Side note: If you’re curious why we place so much emphasis on NNARR growth, see our article on the growth rate of growth rate.

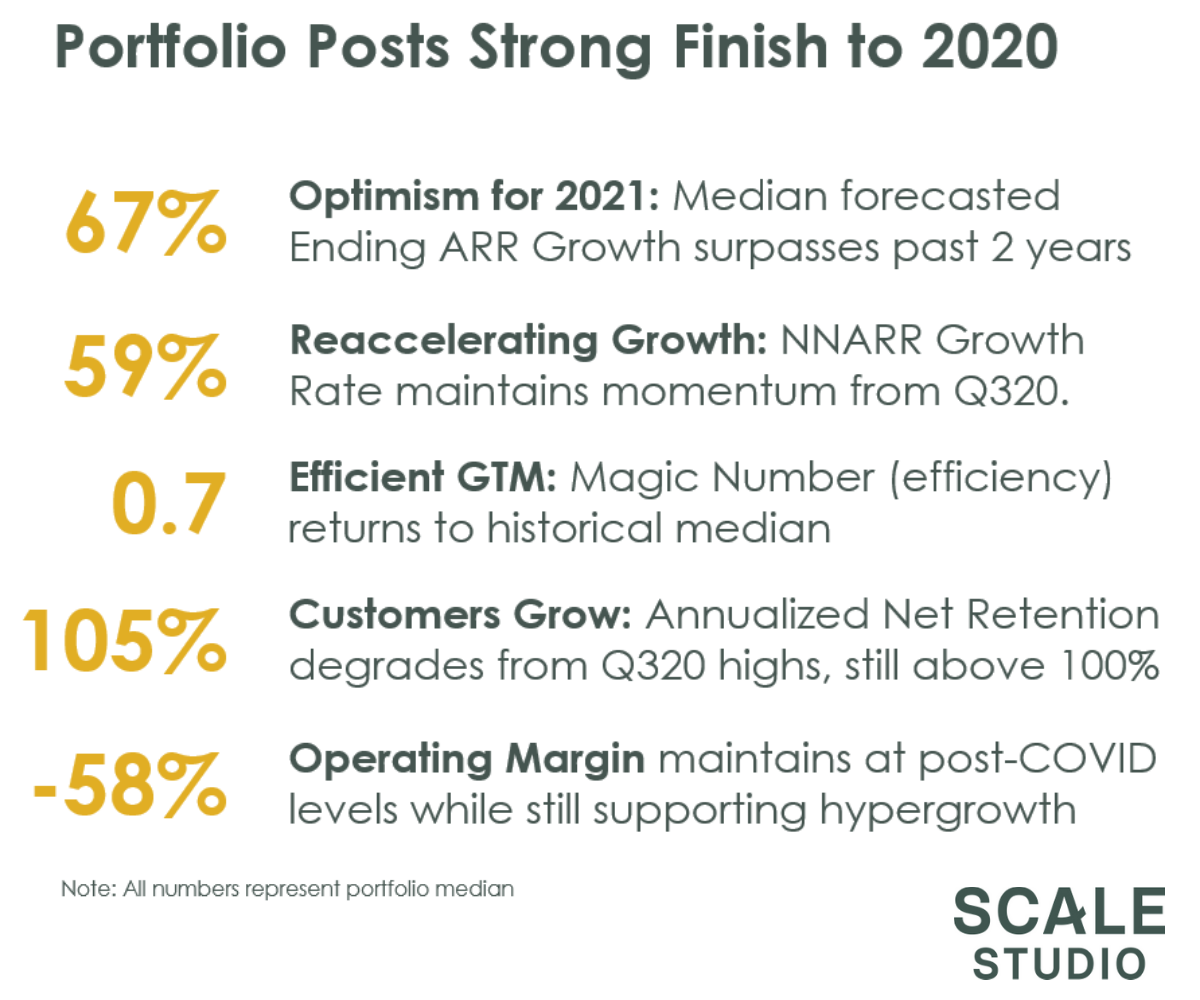
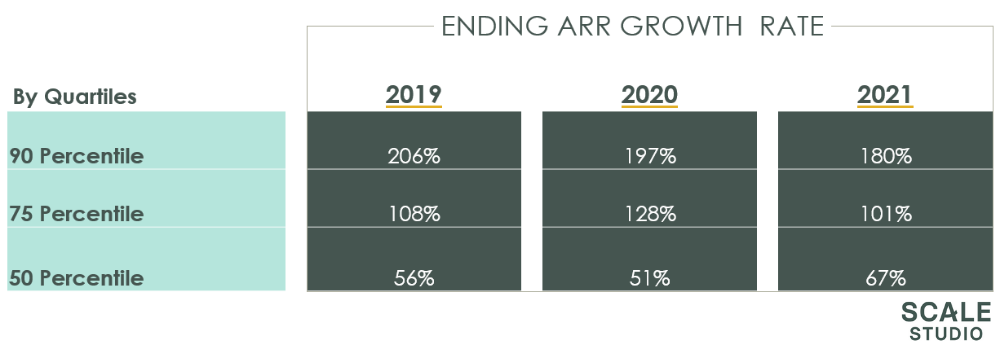
Looking ahead to 2021, companies are targeting reaccelerated growth with a median ending ARR growth rate of 67% compared to 51% in 2020. Here’s the data in table form showing trends for each growth quartile. FY19 and FY20 figures are actual numbers, while FY21 shows forecasts.

Because growth rate is size dependent, the absolute percentage values are less important than the trends. Top performers will continue to shoot for the stars in 2021, and we’d expect these companies will continue to outperform.
Looking at median performers, expectations are for a big uptick in growth compared to 2020 and even 2019. We interpret this as the companies that were hardest hit by Covid feeling pressure to bounce back strongly.
Efficiency Benchmarks
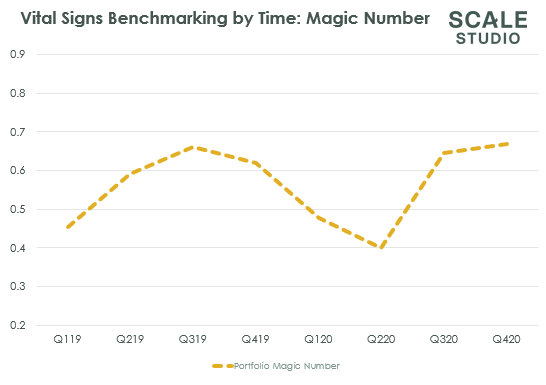
Across the portfolio, efficiency took a hit in 2020 but still recovered back to the 0.7 level by year end. That 0.7 number is important because it represents the long-term median for more than 10 years. As with growth’s recovery, this is no small accomplishment and required fast and effective rationalization of sales and marketing spend to get there.

One silver lining of Covid is that every company at every growth stage was forced to take a long hard look at its operations and perform the sometimes painful steps needed to re-align growth and spending. And broadly speaking, it paid off.
A couple of related data points:
- The portfolio posted customer growth as represented by annualized Net Retention above 100% (down slightly from Q3 highs).
- Median operating margins were -58%, consistent throughout the post-Covid quarters Q2, Q3, and Q4. Loss levels were markedly lower compared to the pre-Covid period.
Efficient Growth Is Electrifying
Let’s connect a few dots. On the growth side of the picture, there is a lot of optimism for re-acceleration in 2021. The companies that survived their customers’ ruthless IT prioritization are looking at 2021 like any other other step-up year. We previously highlighted two potential caveats:
- Strength in 2H20 was in some cases “catch up buying”, inflating the baseline used in 2021 forecasts.
- Annual plans are more than usually optimistic and may be over-correcting against the negative sentiment of 1H20.
The return of Magic Number efficiency to its long-term median demonstrates that startups are able to grow in capital-efficient ways. At this point in a very long up cycle for venture capital, growth — even hyper-growth — doesn’t by itself distinguish a startup in the eyes of investors. It wouldn’t be surprising to see capital efficiency receive more attention from investors in the year ahead. Especially after the scary period in 1H20 where startups and their Boards were re-calculating runways and evaluating access to capital just in case. That lesson may linger for some time.
To put this into practical terms, think about your next fundraising deck. These days, a stellar growth rate slide won’t necessarily grab a lot of attention. Standing out from the crowd may take a follow-up slide that also shows efficient growth, a reflection of operational excellence. That really hasn’t been something early stage startups have needed to plan for and execute on.