Most startups are in the early stages of 2021 planning right now. And that means the question everyone is asking right now is “How much growth is possible next year?”
We’re cautiously optimistic about what lies ahead for enterprise SaaS in 2021. And we’d like to pull back the curtain on our portfolio’s Q3 performance to show you why. We hope to help founders develop their own conviction in what 2021 holds for their businesses and what to start doing about it today.
The data that follows was generated in our benchmark platform Scale Studio and details key growth and efficiency metrics for a sample of 23 companies in our portfolio, representing a cross-section of pre-IPO enterprise software startups at various revenue levels.
Right off the bat, we’ll tell you that the headline here is a return to growth in 2021. That’s great news but it also makes sales capacity planning for next year rather challenging. Scale’s Rory O’Driscoll recently analyzed how much re-acceleration is possible.

Let’s walk through how we developed our cautiously optimistic expectations for 2021.
Finding #1: Return to Net New ARR Growth
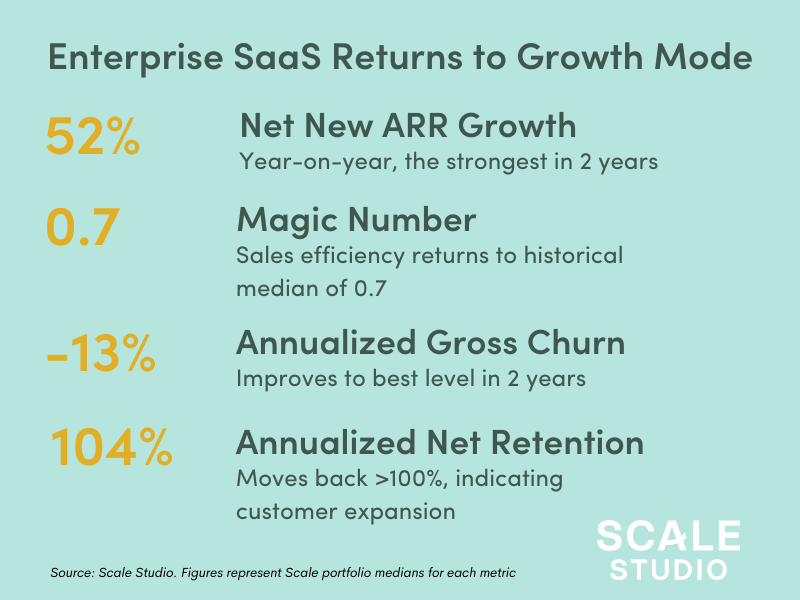
Across the portfolio in Q3, we saw a median Net New ARR growth rate of 52%. That’s the strongest year-on-year growth rate we’ve seen in 2 years and compares to a -15% NNARR growth rate in Q2. Note that a NNARR growth rate of -15% doesn’t mean a company isn’t growing, it just means they are adding Net New ARR at a slower rate than the previous year. growing slower.
Anecdotally, we started seeing Net New ARR growth firm up during Q2 with ebbing fears that the world was ending (for enterprise technology at least). With Q3 on the books, we now see that confidence taking the form of strong NNARR growth.
Finding #2: Better Customer Retention Metrics
Part of the improvement in NNARR can be explained by improved customer retention metrics. Portfolio-wide, median Annualized Gross Churn in Q3 came in at -13%. This, too, is the best Gross Churn level we’ve seen in two years.
We saw strength in Net Dollar Retention as well, rising to 104% during the quarter as churn declined and upsell and expansion improved. For context, both Q1 and Q2 came in below the 100% level.
In operational terms, we believe the improved customer retention picture comes down to two factors:
- Companies figured out how to stabilize sales, support, and customer success processes following the COVID shock earlier in the year
- Customers have a better understanding of their needs and so are making fewer emergency decisions to buy or cancel
Finding #3: Efficiency Climbed Back to its Long-Term Average
Scale’s preferred metric for sales efficiency, Magic Number, has a long-term median of 0.7 over the past 10+ years. In comparison, median Magic Number dropped to 0.4 in both Q1 and Q2 of this year.
In Q3, the median portfolio Magic Number returned to its long-term 0.7 level. As a measure of sales efficiency, we of course chalk this up to all the work that started in March in figuring out how to sell successfully during COVID.
Stepping back, this data shows that companies have figured out how to cut costs and still grow. One of COVID’s silver linings may be the fact that it reminded a lot of companies that it’s possible to walk and chew gum — that is, grow efficiently.
The Big Question: Capacity Planning
Let’s conclude by returning to the question we opened with above: What does Q3 tell us about 2021?
Strength in Net New ARR tells us that the business environment has improved. New sales are happening, upsell and expansion are happening, and churn is returning to acceptable levels. The firming up of Magic Number (sales efficiency) tells us that the COVID adjustment period is now past — spending has been rationalized, processes have been re-engineered. News sales motions are working and should continue to work from here on out.
The net net is that most companies can go into annual planning with confidence that there’s growth to be had in 2021. Start re-building sales capacity and do more of what worked during the bounce-back in Q3.